Olympic history: Women in the Olympics
06 Jun 2018The data used in this post can be downloaded from figshare and the R code is on GitHub.
Introduction
The founder of the modern Olympics, Pierre de Coubertin, held a number of opinions that are at odds with the contemporary “Olympic movement”. For instance, he opposed the inclusion of team sports because he insisted that the Games should be competitions among individuals. He believed that art deserved a firm place in the Games, and even won a gold medal for his poem, “Ode to Sport”, in the 1912 Stockholm Games. Perhaps most famously, he strongly disapproved of women competing in the Olympics, calling the idea “impractical, uninteresting, unaesthetic, and incorrect”. He believed that women could participate in sports so long as they did not “make a spectacle of themselves”, but that in the Olympics, “their primary role should be to crown the victors”.
Coubertin was the founder and first long-term president of the IOC (1896-1925), however he was not the last IOC president to oppose the inclusion of women in the Olympics. Avery Brundage, the American president of the IOC from 1952 to 1972, is perhaps most infamous for being a likely Nazi sympathizer, but he also expressed doubts that women should participate in the Olympics, and argued that certain sports were simply too strenuous for women, such as the shot put or long distance runs.
Despite resistance from many directions, women have turned up to compete in every Olympic Games aside from the first in Athens, 1896. In this post, I investigate historical trends in women’s participation in the Olympics: how many there are, where they come from, and which ones find their way to the podium.
Data exploration
In my first post analyzing the Olympic data, I showed that the number of athletes participating in the Olympics has increased dramatically over time. But how does the increase in the number of female athletes compare to the number of male athletes?
The following chart compares the growth of male and female participants over time. I exclude the non-athletic Art Competitions from the data, and I combine data from the Winter and Summer Games for each 4 year Olympiad (e.g., Sochi 2014 and Rio 2016 are grouped together).
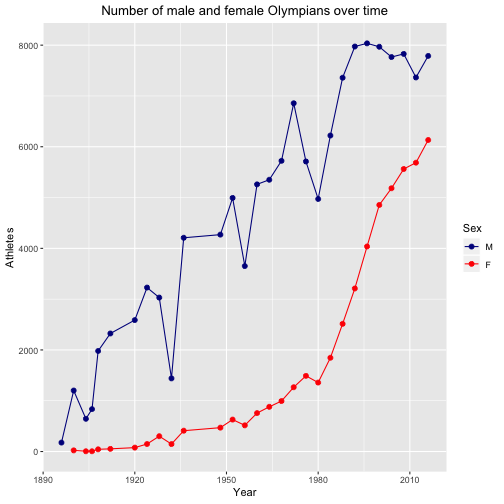
Growth in the number of female athletes largely mirrored growth in the number of male athletes up until 1996, when growth in the number of male athletes leveled off at ~8000, while the number of female athletes continued to grow at a high rate. The participation of female athletes reached its highest point during the most recent Olympiad (Sochi 2014 and Rio 2016), in which slightly more than 44% of Olympians were women.
But not all nations have invested equally in their female athletes: some have embraced the opportunity to win more medals in women’s events, while others have been slow to include women on their Olympic teams. The following chart shows the number of female athletes versus the number of male athletes from 5 select Olympic Games (1936, 1956, 1976, 1996, and 2016), with each data point representing a National Olympic Committee (NOC) and separate best-fit regression lines for each of the 5 Games. Only NOCs represented by at least 50 athletes are included in the plot and regression line fitting. The dashed line represents the ideal of NOCs sending teams comprised of 50% women.
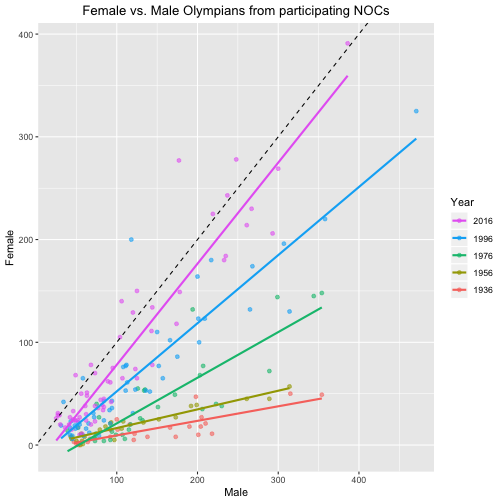
The chart shows that although there wasn’t much change from 1936 to 1956, there was dramatic improvement in female participation from 1956 to 2016. In 1996 and 2016, some NOCs even sent a majority of female athletes to the Games (these are represented by points above the dashed line).
So which NOCs are leading the way for gender equality in the Olympics? The following charts rank nations by the proportion of female athletes on their Olympic Teams. In addition to showing the proportion of female athletes on each team, I show the proportion of each nations’ medals that were won by females. I highlight data from 3 Olympiads: 1936 (Garmisch-Partenkirchen and Berlin), 1976 (Innsbruck and Montreal), and 2016 (Sochi and Rio). Like the previous chart, an NOC must have sent at least 50 athletes to the Games to be included.
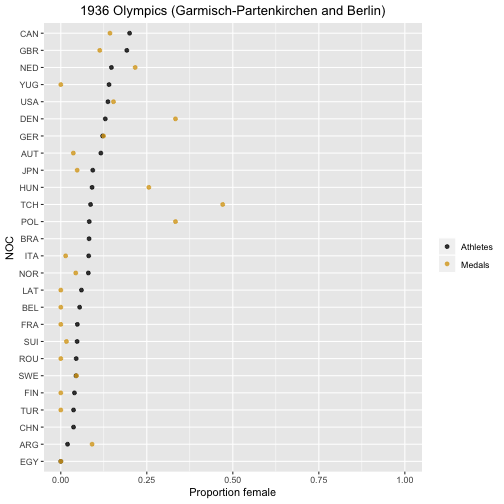
Just 26 countries met the cutoff of sending at least 50 athletes to the 1936 Olympics. Canada lead the way with a 20% female Olympic team, followed by Great Britain with 19%. All other teams sent fewer than 15% women.
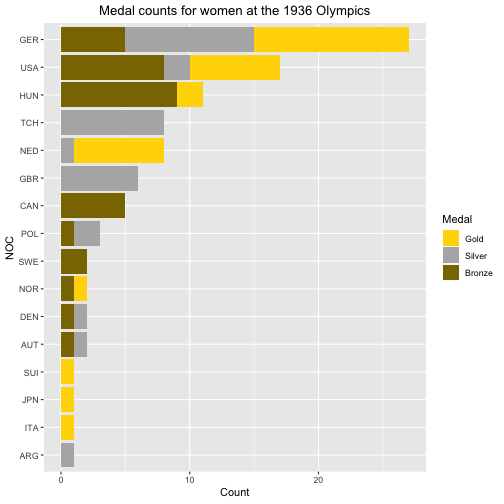
In terms of raw medal counts, the women of Nazi Germany dominated the 1936 Olympics, beating the second place the U.S by a comfortable margin.
Female participation was much higher at the 1976 Olympics, with 12 teams bringing at least 25% women.
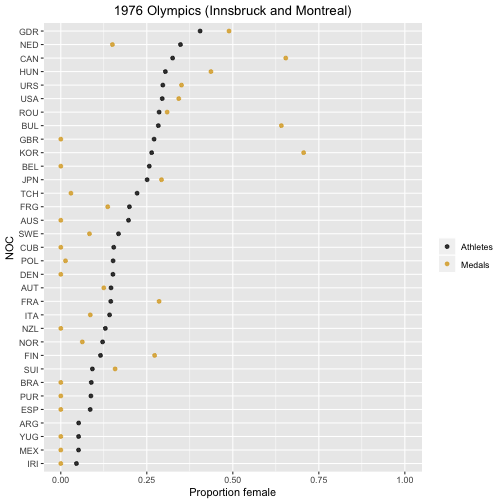
This time East Germany lead the way with 40% of their team being female, followed by the Netherlands (35%) and Canada (33%). The Cold War superpowers, the U.S.S.R. and U.S., also had a relatively large number of female competitors on their teams, with about 29% each.
The raw medal counts reflect the dramatically different state of global political power in 1976 compared to 1936.
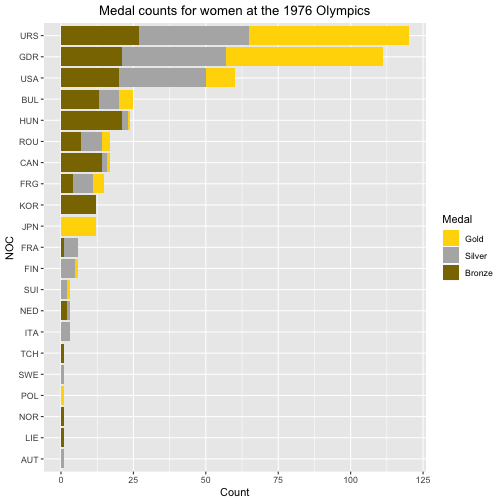
Whereas the women of Nazi Germany dominated the 1936 Olympics, the Soviet Union (URS) and East Germany (GDR) dominated the 1976 Olympics. The U.S. trailed East Germany and the Soviets by a large margin, and no other countries came close.
Forty years later, participation of women in the Olympics surged.
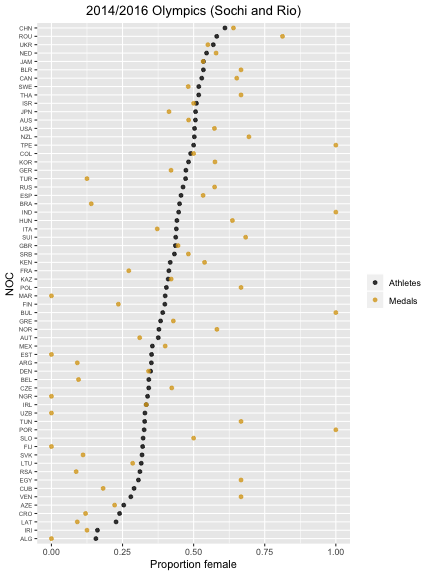
In comparison to 1976, in which not a single Olympic team was comprised of 50% women, the 2014/2016 Olympics included 15 teams that were at least 50% female, lead by China (64%), Romania (58%), and the Ukraine (57%). A few countries won 100% of their medals in women’s events: Taiwan (5 medals in weightlifting and archery), India (2 medals in wrestling and badminton), Bulgaria (7 medals in the high jump, rhythmic gymnastics, and wrestling), and Portugal (1 medal in judo).
Once again, total medal counts in the women’s events reflect changing global power dynamics, with the U.S. dominating the medal count by a large margin. The women of Russia, Canada, Germany, China, and Great Britain formed an impressive but second class tier of female athletes.
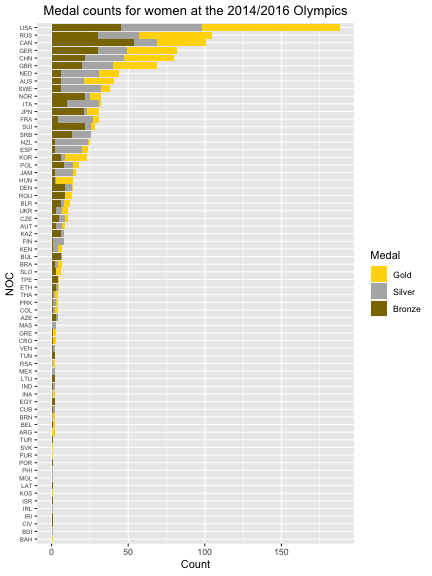
These charts demonstrate that women’s participation in the Olympics has grown dramatically over the past century, although equal participation has not yet been achieved. The Olympics will undoubtedly continue to be an important event for women’s athletics, since for better or worse, nationalism seems to inspire people of diverse nations to care about women’s athletics at least for the brief duration of the Games. In turn, the opportunity for international glory has the potential to motivate governments to invest in women’s athletics even when a self-sustaining model for professional women’s athletics is lacking.
My next post will delve into historical trends in another characteristic of Olympians: the heights and weights of the athletes.
