Olympic history: Geography of the Olympics
04 Jun 2018The data used in this post can be downloaded from figshare and the R code is on GitHub.
Introduction
From Athens 1896 to Rio 2016, the Olympics have traveled to 42 different host cities and included athletes from hundreds of nations. In this post, I use maps to visualize where the Olympics have been held and which nations the athletes hail from. To help reveal broad historical patterns, I define three Olympic “eras”.
- Pre-Cold War era, 1896 to 1936 (16 Games)
- Cold War era, 1948 to 1988 (22 Games)
- Post-Cold War era, 1992 to 2016 (14 Games)
There are certainly other ways to divide Olympic history, but it makes good sense to classify the Olympic Games into periods before, during, and after the Cold War. Prior to WWII, the Olympics was essentially a Western European and North American event, and was exclusively for “amateurs”. The Cold War fundamentally altered the scope and significance of the Olympics, as the Games became an arena for Cold War tensions. Participation in the Olympics was predicated upon official recognition by the IOC, and such high-profile international recognition was coveted by many nations seeking legitimacy in the post-WWII era. On the other hand, many nations and ideological groups used the Olympics as an opportunity to air grievances against other nations through boycotts or even terrorism.
The diversity of the Olympics improved dramatically during the Cold War era, with the increased participation of South American, African, and Asian athletes. Many nations, with the U.S. and the U.S.S.R. being the most extreme, invested heavily in their national sports programs because success at the Olympics promoted nationalism and was interpreted as evidence of the superiority of their economic and political systems. Another major shift that began to occur in the context of Cold War competitiveness was the increasing difficulty of maintaining “amateurism” as a central feature of the Games.
The first post-Cold War Olympics was held in 1992, and nothing is more emblematic of this new phase of Olympic history than the total domination of the American “Dream Team” in basketball and the subsequent controversy over whether they would wear Nike or Reebok apparel on the podium. The post-Cold War era is characterized by the rapid commercialization of the Games: the sale of expensive broadcasting rights, the rise of “official” corporate sponsorship, and the inclusion of established professionals alongside unknown athletes who hope that the Olympics might be a springboard to personal wealth and fame. The number of participating nations continued to grow during this period, in part due to the emergence of new nations in the aftermath of the Soviet breakup and in part due to a continuation of the Cold War trend of nations seeking legitimacy through recognition by the IOC.
With this historical context in mind, let’s look at how the geography of the Olympics has changed over time, focusing first on host cities and then on athletes.
Mapping host cities
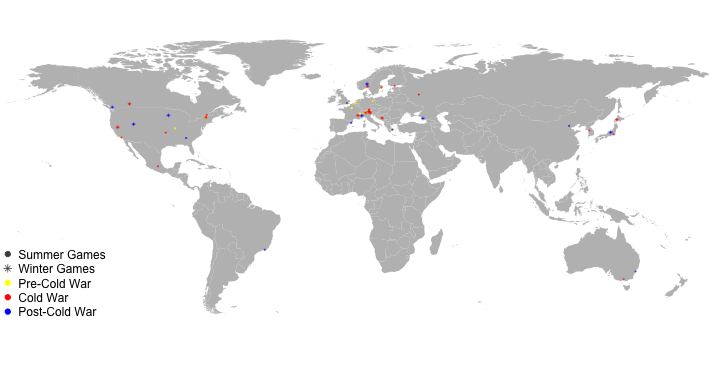
The data used to generate the following plot can be found here. Points are colored based on the time period in which the Games occurred (before, during, or after the Cold War), and two different plotting symbols are used to distinguish between Summer and Winter Games.

The map shows that the pre-Cold War Olympics were held almost exclusively in Western Europe, with just one Games being held in the U.S. (that is St. Louis, 1904). During the Cold War, the Olympics traveled much more widely, returning to North America multiple times and branching out to the Soviet Union, Australia, Japan, and South Korea. However, the Olympics has not expanded far beyond these regions in the post-Cold War era. Rio 2016 is an exception, representing the first and only Olympics to be held in South America. There has yet to be an African, Middle Eastern, or Southeast Asian host, and this won’t change any time soon, as the next several Olympics have been awarded to familiar regions: Tokyo, Beijing, Paris, and L.A.
Mapping international representation
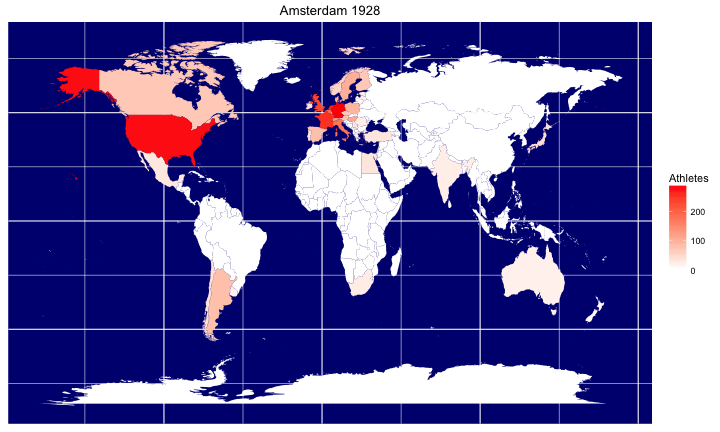
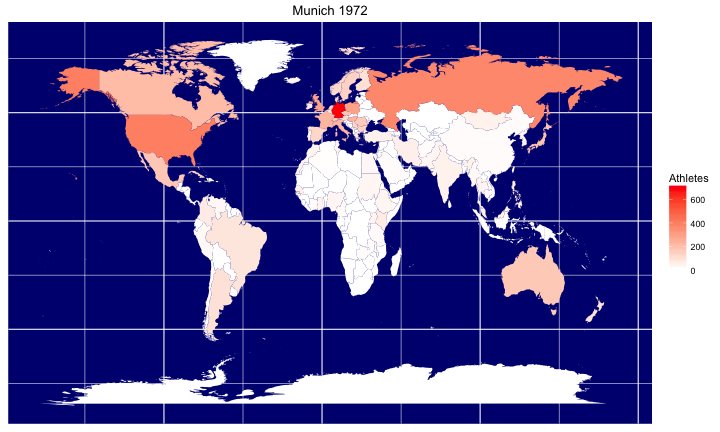
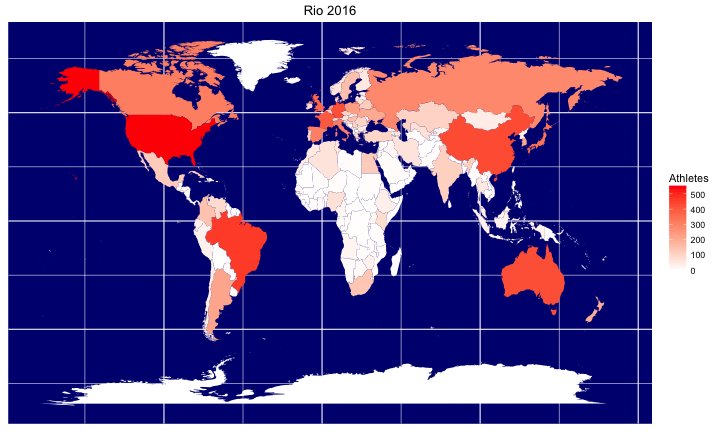
To visualize historical trends in where athletes come from, I simplify things a bit by highlighting data from one representative Olympic Games from each of the three eras. In order to capture as much diversity as possible, I selected three well-attended Summer Games that had no boycotts or major absences. These three Games are spaced apart by exactly 44 years:
- Amsterdam 1928: Boycott-free Olympics with the second highest pre-WWII attendance after the 1936 Nazi Olympics (but the Nazi Olympics had several boycotts)
- Munich 1972: Boycott-free Olympics in middle of the Cold War era with the second highest attendance during this period (the highest attendance was at the Seoul 1988 Olympics, but there were also several boycotts)
- Rio 2016: Boycott-free Olympics with the highest attendance in history, as of 2018
To produce maps, I had to match up National Olympic Committees (NOCs) with countries, which can be a bit tricky since both NOCs and countries are political entities that have not remained constant over the history of the Olympics. See the ‘notes’ column of the data file to see places where I matched tricky NOCs with contemporary countries. Even though it isn’t perfectly accurate, the resulting maps still capture overall patterns in the nations being represented at the Games.


It is clear from these plots that geographic representation in the Olympics has expanded over time, although several parts of the world are still severely underrepresented. These include most of Africa, Southeast Asia, the Middle East, and much of South America (although Brazil made a strong showing at the Rio Olympics).
In my next post, I explore a different aspect of diversity in the Olympics: the participation of women.
